As a leader, do you want to grow your business? Who doesn’t want to succeed, right? How do you measure the success of your business? What metrics do investors look at before funding? Enter Key Performance Indicators (KPIs).
In this blog, I have given you an extremely detailed list of KPIs that can define the success of your business. I have also segregated them based on industry and function. I have included,
- What is a KPI?
- Why should small businesses consider using any KPI?
- What are the different types of KPIs?
- What are the important KPIs to track based on the industry you work in?
- What are the KPIs you should be looking at based on your department or function?
- KPIs for the Sales department
- KPIs every Marketing person should know and use
- What KPIs should the HR department use?
- List of top KPIs for the Finance department
- The customer service team should look out for these KPIs
- KPIs that will help a project management team
- KPIs every engineer should track
- Top KPIs for product managers
- What are the KPIs that investors look for in startups?
- How to track remote employees’ work progress with KPI?
- How should you choose the right set of KPIs for your small business?
- What are the steps involved in preparing a KPI report?
- How to track KPI with Asanify?
- Summary
- FAQs
What is a KPI?
KPI stands for Key Performance Indicator. It is a value that can be measured and tracked over a period. It helps keep a check on an organization’s success or lack thereof at various stages of the company. Different departments, roles and industries track different KPIs to ensure the best results for their company. Your choice of KPIs as well as how you analyse them can help you improve the way you do business or push you in the wrong direction. Whether you want to transform your business or maintain your current status, they will help you set goals, allow you to track your actions that lead to those goals and ensure a more efficient process in reaching those goals. Hence, you must keep revising your KPIs over time and make sure you use the right ones.
What is a S.M.A.R.T. KPI?
Be wise while choosing your KPIs. It could make or break your growth. Your choices need to be SMART. What does it mean when I say be SMART, i.e. Specific, Measurable, Achievable, Relevant and Time-bound.
- Specific – You need to choose extremely specific indicators. Say, for example, if you want to improve your customer support system, set clear goals like to reduce the response time for customer queries by 1 minute, or lower the hit rate by half.
- Measurable – These goals should be measurable or countable. In the example mentioned earlier, the time taken to respond to queries and the number of hits is countable.
- Achievable – Make sure the goals are achievable and realistic. If you set goals that are not achievable, you will only end up with a demoralized team and hardly any improvement at all.
- Relevant– Needless to say, your goals should be relevant to your business. If you don’t offer any customer support (maybe because you sell a one time use, disposable product) then setting a goal like reducing query response time is pointless. On the other hand, it is very important for a SaaS product.
- Time-bound– When you set a goal it is of utmost importance to set a timeframe within which those goals need to be achieved. Taking the same example as mentioned above, a time-bound goal would look like this- reduce the response time for customer queries by 1 minute over the next months, or lower the hit rate by half over the next 4 months.
Why should small businesses consider using any KPI?
KPIs can help you assess your company’s progress, track growth, set new goals and milestones and reach them in the most efficient way possible. Here’s why KPIs are important.
To set measurable goals and targets
A KPI will help you set a goal that is specific, measurable and achievable, the S, M and A from SMART goals. These goals will help your business strategize better and have clearer paths towards those goals. Keeping track of how close or far you are from your goal, will help you understand the hurdles you need to cross to reach your result. This in turn will help you plan and execute things more efficiently as well. The goals don’t need to be very elaborate or big, simple small steps will help you reach your target better.
Increase accountability
When employees know the KPIs that are set for them, they will also be able to keep track of their own work. When you set weekly or monthly goals and review your plan daily, you end up encouraging your employees to do the same. Employees should also be required to brief their supervisor as to where they stand in terms of their goals and plans. As a result, accountability increases and also push up the overall productivity.
To make adjustments and improvements
When you set goals for your company or team, your need to make sure that the steps to be followed to reach those goals are correct. You also need to figure out if you are on the most efficient growth path. When you track KPIs, you will be able to see how effective your plans are and where they fall short. Thus, you can make changes or improvements wherever needed.
To keep track of the growth of your startup.
When you track any particular KPI, it will show you how much your company is growing. For example, increasing your number of new employees, tracking the efficiency of a new leave policy, the percentage increase in revenue etc. In today’s day and age, it isn’t enough to merely maintain a steady business or survive. You need to be able to push your boundaries and limits as much as possible to stay ahead of your competitors. Therefore, the right KPIs will help you keep a check on your growth levels.
What are the different types of KPIs?
There are different types of KPIs that you could use and I explained each type below.
Lagging KPI
A lagging KPI deals with analysing current trends and outcomes. It allows you to make informed data-driven decisions. A lagging KPI is more output-based and hence easy to measure. With the help of a lagging KPI, you can measure current net profit, revenue, increase in sales etc. and also gain future insights based on them.
Some examples are-
- Leads converted over the last year
- Annual or monthly recurring revenue
- Click-through rate (CTR)
- The number of transactions per week
Very often companies rely heavily on lagging indicators because they can be very easy to track. This is because they are trends of events that have already occurred. However, a good set of KPIs would include both lagging as well as leading KPIs, which brings me to the question,
What is a leading KPI?
A leading KPI focuses on the factors that point towards the future. It tells you how to measure and predict future direction. Leading KPIs can often work as early warning systems. When you realise not many customers promote your brand, there is a good chance they will move away from your brand. Some examples are,
- Net Promoter Score (NPS)
- Subscriptions to your newsletter
- 360-degree evaluation of employees (for HR)
What is a quantitative KPIs
A quantitative KPI deals with numerical data. It uses statistical analysis to arrive at a conclusion and hence make decisions based on numbers. Quantitative KPIs are the most commonly used KPIs because they are definitive and objective in nature. Some examples are-
- Sales over the last year
- Attrition rate among employees
- Variance in budget
Qualitative KPI
Such a KPI deals with more descriptive data as opposed to numerical (like in the case of quantitative KPIs). While sometimes the data used to understand a qualitative KPI may be numerical or statistical, the KPI in itself is subjective in nature. For example,
- Employee engagement
- Customer satisfaction (CSAT score)
- 360-degree feedback for an employee
Input KPIs
Such KPIs are used to track the inputs in any project or process. They keep a check on the capital or human aspects of any operation. Some examples are,
- Labour hours put into working on a project
- Money spent on equipment
- Salary of workers
They are basically the leading indicators of your output. But what are output KPIs?
Output KPIs
An output metric shows you the final output of a project. A few examples of output KPIs would include,
- Sales of a particular product
- Net profit generated over the last year
- Total registered demos on your website
Effectiveness vs efficiency measures
Some KPIs measure effectiveness where are some measure efficiency. Let us see what Charu Purohit has to say about KPIs

“I love KPIs. What gets measured gets done. However, it is important to identify and prioritize- too many don’t work. Also sometimes there are too many efficiency KPIs. It is important to balance efficiency vs effectiveness. E.g. you do great on training hours per employee but you don’t measure how it translates to better job performance”
Charu Purohit, Head of Rewards at Nykaa, Top 40 under 40 HRs in India
What are the most important KPIs to track based on the industry you work in?
The KPIs you choose should be based on the industry you work in. Different industries look at different factors while measuring growth. So, here’s a segregation of the KPIs based on industry.
KPIs to be considered by Saas companies
- Monthly Recurring revenue– Revenue that remains constant and occurs every month
- Annual recurring revenue– Revenue that remains constant and occurs every year
- Expansion ARR– Current customers who expand their subscription from the previous year
- Expansion MRR– Current customers who expand their subscription from the previous month
- Number of active users– Total number of active users at any given point
- Net profit– Net profit is the difference between total revenue and total expense
- Customer acquisition cost (CAC)– Cost of adding on an additional new customer
- Lead velocity rate– Rate at which lead convert to clients/customers
- Customer lifetime value– Average time a customer stays with your business/product
- New signups– New registrations or signups for the product/on the website
- Number of support tickets generated– Number of queries generated in the customer service software
- Average query resolution time– Average time taken to completely resolve any query
- Net promoter score– Likeliness to recommend the product to friends
What KPIs should be considered by the E-commerce industry
- Cart abandonment rate– Number of people who add a product to cart then leave the website
- Average order size– Value of total orders divided by number of orders
- Average cost per customer– Total cost occurred divided by the number of customers
- Website traffic– Total number of visitors to the website
- Conversion rate– Rate at which lead convert to clients or customers
- Click-through rate (CTR)– Number of people who click on your advertisement to visit your website
- Unique page visitors– Site visitors, but the same person visiting multiple times is counted only once
- Number of transactions– Number of purchases or transactions on the website
- New Vs returning customers’ orders
- Product affinity– Set of products customers buy together. This helps in cross-selling
- Inventory levels– Number of products in stock, available to sell
- Competitive pricing– Price of a similar product sold by competitors (pricing your product not very far from their price, sometimes even slightly lower for a competitive edge)
- Churn rate– Rate at which people stop using your product/stop doing business with you
- Loss of revenue due to churn
- Customer acquisition cost– Cost of adding on an additional new customer
- Number and quality of product reviews– To keep track of positive or negative reviews
List of KPIs every manufacturing company needs
- Operating expenses– Includes rent, equipment, inventory costs, marketing, payroll, insurance, step costs, and funds allocated for research and development.
- Operating expenses ratio– Operating expenses divided into total expenses
- Asset utilization– Total revenue earned for every dollar of assets a company owns
- Opportunity gap– Different between what an asset is capable of producing and what it actually produces
- Product cycle time– Time to manufacture a single product
- Average labour cost– Total cost of labour divided by the number of workers
- Labour usage–
- Manufacturing cost per unit– Total manufacturing cost divided by the total units manufactured
- Average time to repair failures– Average number of hours or minutes taken to repair failures
- Average delivery time– Average number of hours or minutes taken to deliver the product
- Overtime as a percentage of total Hours– Number of hours logged in overtime as a percentage of total hours worked
- Number of non-compliant events– number of unplanned or non-compliant events (errors)
- Production yield– Total production i.e. total units produced
- Overall equipment effectiveness– Percentage of manufacturing time that is productive, i.e. time for which machine is producing goods
- Overall labour effectiveness– Percentage of manufacturing time that is productive, i.e. time for which labour is producing goods
- Gross merchandise value– Total sales value of the merchandise
- Safety precautions– Covid safety precautions in place for the benefit of workers
What are the KPIs you should look at if you are in the IT sector?
- Unscheduled downtime– time for which the service/website is down
- Number of defects
- Number of bugs
- Service renewal rate– Customers or clients who renew their subscription
- Conversion rate– Rate at which lead convert to clients/customers
- Customer lifetime value– Average time a customer stays with your business/product
- New leads– New leads generated in a particular month
- Revenue increase– Increase in the revenue over the previous month
- Runway or Burn rate– Amount of time company has before running out of money
- Cost per lead– Cost incurred for every additional lead
- Actual IT spending Vs planned budget
- Initiatives driven by IT to improve IT products and services
- External events or seminars attended (by employees)
- Improved risk management– Total number of SIRT incidents
- Percentage compliance to the training plan– number of training sessions actually conducted divided by the total number of planned sessions
Which KPIs should startups use?
Internal Growth Dashboard Metrics
- Current progress – Current number of Monthly Active Users (MAUs) and the progress made towards quaterly MAUs target
- MAU Forecast – Expected number of MAUs after evaluating the growth rate
- MAU Accounting – Factors contributing to the most of MAU growth
- MAUs by app
- MAUs by gender
- Total Signups
- Signups through app
- Total invites sent
- Signups through invites
- Signups through referrers
- Overall Activation Rate – Percentage of new signups that visits the page again in the week following signup
- Signups to engagement funnel – Percentage of new signups that are still doing key actions during a one-week time window of 28-35 days after signup
- Email summary by type – Total number of emails sent, opened and clicked
- Push notification summary by type – Total number of push notifications sent and clicked
- Ressurections – Dormant user accounts for 28+ days but then became active on the platform
Other KPIs
- Monthly sales
- Lead velocity/conversion rate– Rate at which lead convert to clients or customers
- Gross profit– revenue minus cost of goods
- MRR/ARR– Monthly or Annual recurring revenue- Revenue that remains constant every month
- Total contract value– Total value of all the contracts currently with the business
- Annual contract value– Total value of all the contracts currently with the business in the current year
- Customer concentration risk– Customers who contribute to the highest revenue
- Customer Acquisition cost– Cost of adding on an additional new customer
- Cohort retention– number of active users from the same cohort in a day, divided by the number of users the cohort started with on day 1
- Market share– The proportion of the market controlled by the company
- Virality– To measure virality, multiply the current users by a k coefficient (the k coefficient is the average number of friends or relatives any customer will talk to, about your product. In short the k coefficient, in this case, is similar to the net promoter score)
- Net promoter score (NPS)– How likely is a customer to recommend your product, service or company to a friend or relative.
- Platform risk– dependency on a specific channel or platform
What are the KPIs you should be looking at based on your department or function?
Different departments within a company look for different KPIs. Marketing will look for things related to customer engagement whereas finance will analyse the profit and loss statements, HR will look out for employee-related metrics etc. So here I have added a list of top KPIs for each department within an organisation for better clarity.
KPIs for the sales department
- Sales conversion– The rate at which lead convert to clients or customers
- Leads to opportunity ratio– Ratio of unqualified to qualified leads
- Sales revenue– Total revenue earned from the sale of a product
- Days sales outstanding– Average number of days it takes for a company to receive the payment for its sales
- Average order size
- Average cost per customer– Total cost divided by the number of customers
- Customer acquisition cost– Cost of adding on an additional new customer
- Customer lifetime value– Average time a customer stays with your business/product
- Number of active users
- Churn rate or attrition rate– Rate at which people Stop using your product/stop doing business with you
- Cart abandonment rate– People who add a product to the cart then leave the website

KPIs every Marketing person should know and use
- Market share– Proportion of the market controlled by the company
- Market share growth rate– Difference between the market shares of 2 consecutive years or months, divided by the total market share
- Website traffic– Total number of visitors to the website
- Conversion rate– Rate at which lead convert to clients or customers
- Website click-through rate (CTR)– Number of people who click on your advertisements to visit your website
- Unique page visitors– Site visitors, but the same person visiting multiple times is counted only once
- Social media posts’ likes
- Shares received on social media posts
- Social media posts’ comments
- Newsletter subscriptions– Total number of subscriptions to your newsletter or blog
- Email open rate– Number of people who at least open the email that is sent through an email campaign
- Email CTR– Number of people who register at least 1 click (to social media, demo registrations, visits to websites etc.) after offer opening the mail
- Cohort retention– number of active users from the same cohort in a day, divided by the number of users the cohort started with on day 1
- Market share– The proportion of the market controlled by the company
- Virality– To measure virality, multiply the current users by a k coefficient (the k coefficient is the average number of friends or relatives any customer will talk to, about your product. In short the k coefficient, in this case, is similar to the net promoter score)
- NPS- (Net promoter score) How likely is a customer to recommend your product, service or company to a friend or relative.
What KPIs should the HR department use?
- Net promoter score– How likely are your employees to promote your organization as a good place to work
- Average tenure of an employee– Average time an employee stays with your organization
- Employee retention rate– The percentage of employees who you retained from one period to the next
- Turnover rate– Percentage number of employees who leave an organization
- Employee absenteeism- When an employee is absent from work, excluding paid leave
- Overtime as a percentage of total hours– Number of hours logged in overtime as a percentage of total hours worked
- Average training cost– Total training cost divided by the number of employees
- Number of training days or hours per employee– Average number of days/ hours required/ taken to train an employee
- Recruiting conversion (shows employer brand)- Number of candidates who accept a job offer over the total number of offers sent out
- Workforce gender ratio– Number of females to males in an organization
- Dismissal rate– Number of employees fired to total employee exits
- Time to fill in an empty role (average number of days)
- Average cost per interview– Average cost of interviewing a single candidate
- Number of leave or vacation days per employee
- Employee innovation index
- Percentage compliance to the training plan– Number of training sessions actually conducted divided by total number of planned sessions
- External events or seminars attended
- Internal promotion rate– Number of employees promoted compared to new employees brought in for a higher-level role
- 90 day quit rate
- Percentage cost of the workforce– Workforce or labour cost as a percentage of total organisation’s cost
- Each employee’s 360-degree feedback score
- Attrition rate– Number of employees leaving the organization
- Attrition within HIPO talent pool– Number of high potential employees leaving the organization divided by the number of high potential employees
List of top KPIs for the finance department

- ARPU– Average revenue per user (Total revenue generated in a period divided by the total number of active users during that time frame)
- Revenue growth rate
- MRR or ARR– Monthly or annually recurring revenues
- Average revenue (per customer)
- Net profit
- Gross profit
- Gross margin ratio-Gross profit divided by net sales
- Operating cash flow– Cash generated by the company’s normal operations
- Operating expense ratio– Cash used to operate a piece of equipment compared to the income generated by it
- Cash runway or burnout rate– Number of days within which the company can use up all money
- Quick ratios (Acid test ratio)– Financial ability of the company to pay off current liabilities. It checks the short term financial health of the company. The formula is the difference between the current assets and inventories divided by the current liabilities.
- Current ratio– As opposed to quick ratio, the formula for current ratio is current assets divided by current liabilities. It doesn’t take into consideration liabilities. Current ratio checks the company’s ability to pay off short term obligations especially within that of the current year.
The customer service team should look out for these KPIs
- Average query resolution time– Time taken to resolve a query (right from the time of issuing a query ticket up until the query is completely resolved.
- First response time– Time taken by a customer support employee to get in touch with the customer who lodged a complaint (the first time)
- Active issues– Total number of active issues at any given time
- Backlog– The issues that have been active for a while maybe over a week but should have been solved
- Service escalation rate– when a customer asks to speak to the supervisor
- Hit rate– number of queries recorded to the total sales
- Number of issues– Total number of issues or complaints coming in within a particular timeframe
- Customer retention– Ability to retain a customer even after a complaint is lodged
- Net promoter score– How likely is a customer to recommend your product, service or company to a friend or relative.
KPIs that will help the project management team
- Hours worked by each employee– Average number of hours put in by each employee working on the project
- ROI– Return on the investment put into the project as a whole
- Cost variance– Variance or difference in planned cost of the project versus the actual cost
- Cost performance index– Earned value divided by cost
- Schedule performance index– Earned value divided by planned value
- On-time completion percentage–
- Budget variance – Estimation versus actuals
- Number of complaints
- The total number of cancelled projects (cancelled or even started but failed, as compared to the ones that were completed)
- Number of milestones accomplished on time (with signoff)
KPIs every engineer should track
- Number of defects per project– Number of defects that occurred on a particular project within a given span of time
- Number of errors per engineer– Average number of errors made by the engineers (Total errors divided by the total number of errors) Also important to track individual errors made by each engineer)
- Actual cost per employee– Th actual amount of money you spend on an employee including salary, training and development and any other perks and benefits
- Number of bugs per project
- Number of bugs per employee
- Additional days beyond budgeted estimate– The number of days it takes to complete the project beyond the initially planned number of days
- Missed milestones/deadlines– The number of projects that were cancelled for various reasons or that were not completed on time as planned (delayed)
Top KPIs for product managers
- Downtime– The amount of time in hours for which the product is down or not working (in case of SaaS products or IT services)
- On-time orders– Orders or projects that were completed on time
- Planned vs production time and cost– Difference between the time and/or cost of completion of the product or module within a product
- Overall operational effectiveness–
- Overall equipment effectiveness
- Manufacturing cycle time– Time taken to manufacture or produce a single unit of the product from start to finish
- Throughput– avg units produced in a given time
What are the KPIs that investors look for in startups?
When investors look at investing in a business, there are many factors taken into consideration. Fundraising for any founder can be stressful, especially when it comes to seed funding. There are certain KPIs that investors look at before investing, while some are tracked after they have put money in your business.
When you get an investor onboard, they expect you to expand and transform your business for the better. This includes
- Hiring many, but good quality new employees
- Training them to do their best, especially sales training, to push for higher sales and lead conversions
- As a result of the training, to grow your business strategically with well-managed finances
But what are the KPIs you should track before you start reaching out to investors?
Top KPIs investors look out for
- ARR or MRR– (Annual recurring revenue or Monthly recurring revenue) Revenue that remains constant and occurs either monthly or annually
- Percentage growth of revenue (month on month)
- ARPU– (Average revenue per user) (Total revenue generated in a period divided by the total number of active users during that time frame)
- Runway or burnout rate– Number of days within which the company can use up all money
- Users of the product (actuals versus forecast)
- New customers– New customers or clients register over the past week or month
- Churn rate– Also known as attrition rate, it is the rate at which people either stop using your product or stop doing business with you
- Conversion rate– Also known as lead velocity rate, it is the rate at which lead convert to clients or customers
- Customer lifetime value– Average time a customer stays with your business or product
How to track remote employees’ work with KPIs
With the increase in covid cases across the country especially now with the second wave, most companies are now working from home. Not only does this put pressure on the plans of HR heads of new companies, but also on the founders. Here are a few things to keep in mind while tracking employees work at home
- Create a good work from home policy for all your employees
- Use an automated tool or software (Asanify is a good option)
- Use similar KPIs that you would otherwise track employees’ work
- Make sure that you take steps to keep the motivation levels up in these difficult times
How should you choose the right set of KPIs for your small business?
What you can measure, you can definitely improve. But you need to measure the growth of your business correctly and with the right KPIs.
While there is no sure shot one size fits all way to pick and choose the right KPI, you certainly need to know how and on what basis to make this choice. But choosing the wrong one do a lot of harm and cause a huge waste of time. This is because KPIs are measured over time.
Consider the business’ objectives and company’s growth stage
What is your most current business objective or goal. Is it to gain a larger customer base? Is it to improve your company’s brand recall? It is to increase customer loyalty? Each question mentioned below will have a separate list of KPIs and if you don’t choose the correct one you might not be able to track your progress properly. They need to be connected directly with your business.
Choose KPIs that are measurable
Remember I spoke about S.M.A.R.T. KPIs? Where M stands for measurable. If you choose a KPI that you can’t even measure at the end of the day then what’s the point? Make sure that all the KPIs that you choose can be tracked.
Focus on fewer metrics rather than being overloaded with data
Very often, founders of business heads choose many, many KPIs. This not only makes it difficult to track but also ends up being time-consuming and kind of useless. Instead of going all out and trying to track many KPIs, be wise and choose a few that are both accurate and aligned with your business goals.
When you have fewer specific reports to track it becomes that much more efficient to prepare reports and help adjust and improve those KPIs.
Pick a good combination of leading and lagging metrics
Very often, people make the mistake of choosing only lagging indicators. These are relatively easier to track since it focuses on outcomes and events that have already occurred. But an excellent set of KPIs is one that has a good mix of both leading and lagging indicators. Earlier on in this blog, I wrote about both while giving examples.
How to prepare a good KPI report?
We’ve already done a thorough analysis into a wide range of subtopics like what are KPIs, which ones can be used for different industries, company departments, how to choose a KPI effectively, etc. But what do you do next? How do you write a good KPI report? These are a few things to keep in mind.
- List down your business goals and objectives
- Add details about the KPIs that you are tracking
- Identify the source of the data, based on which you will understand how each KPI is doing. (Example: where would you get data to track CSAT scores, or how would you collect social media engagement metrics?)
- Use visuals like graphs, bar charts, etc. to represent the data efficiently.
Here’s how you can track KPIs of an employee using Asanify:
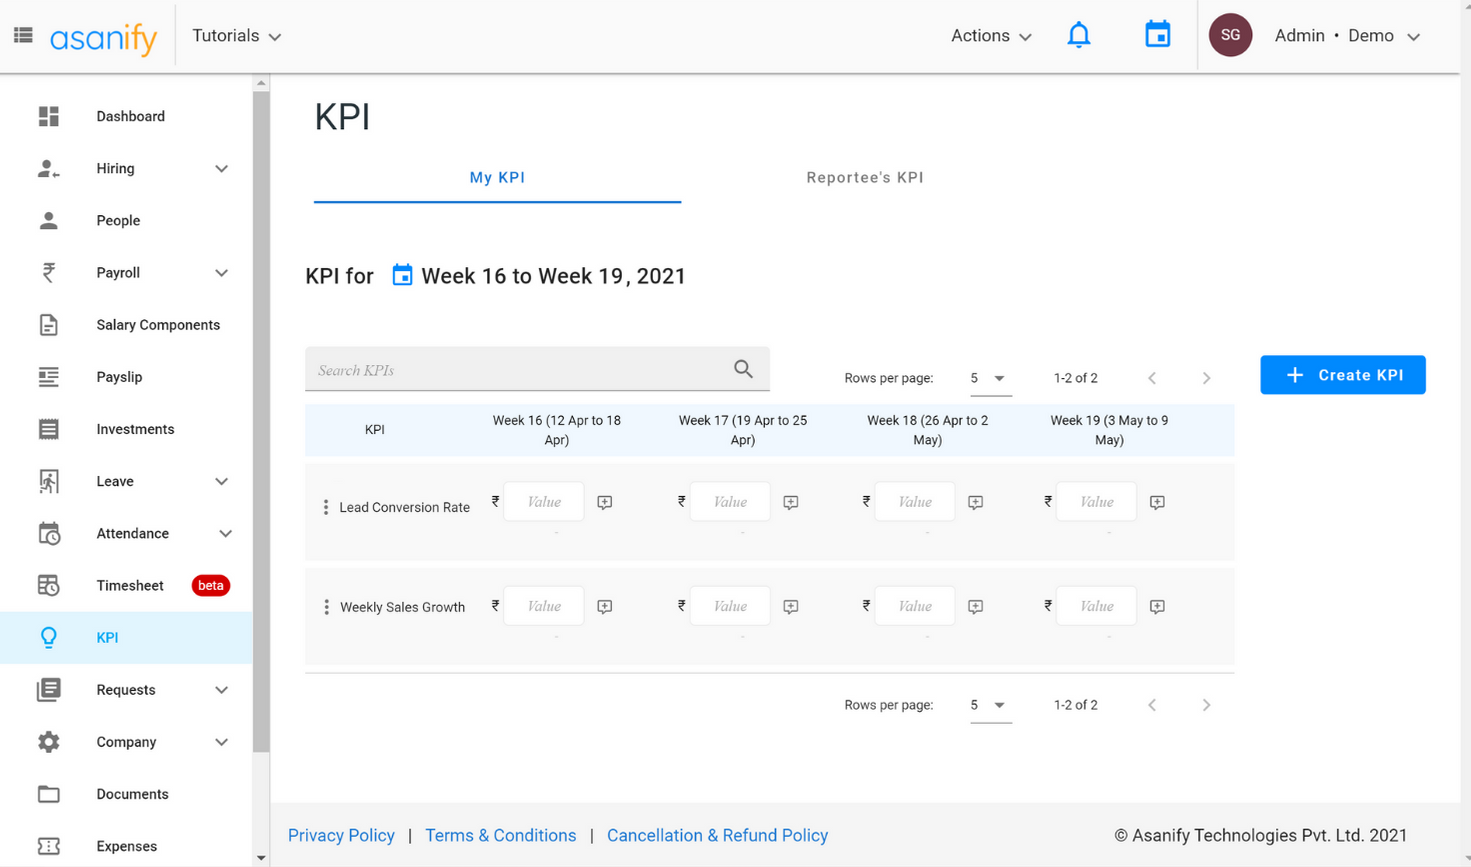
- Go to the KPI page in the Asanify software
KPI tracking is one of the many features Asanify has to offer. Then go to the KPI section and follow the next steps.

- Create a KPI
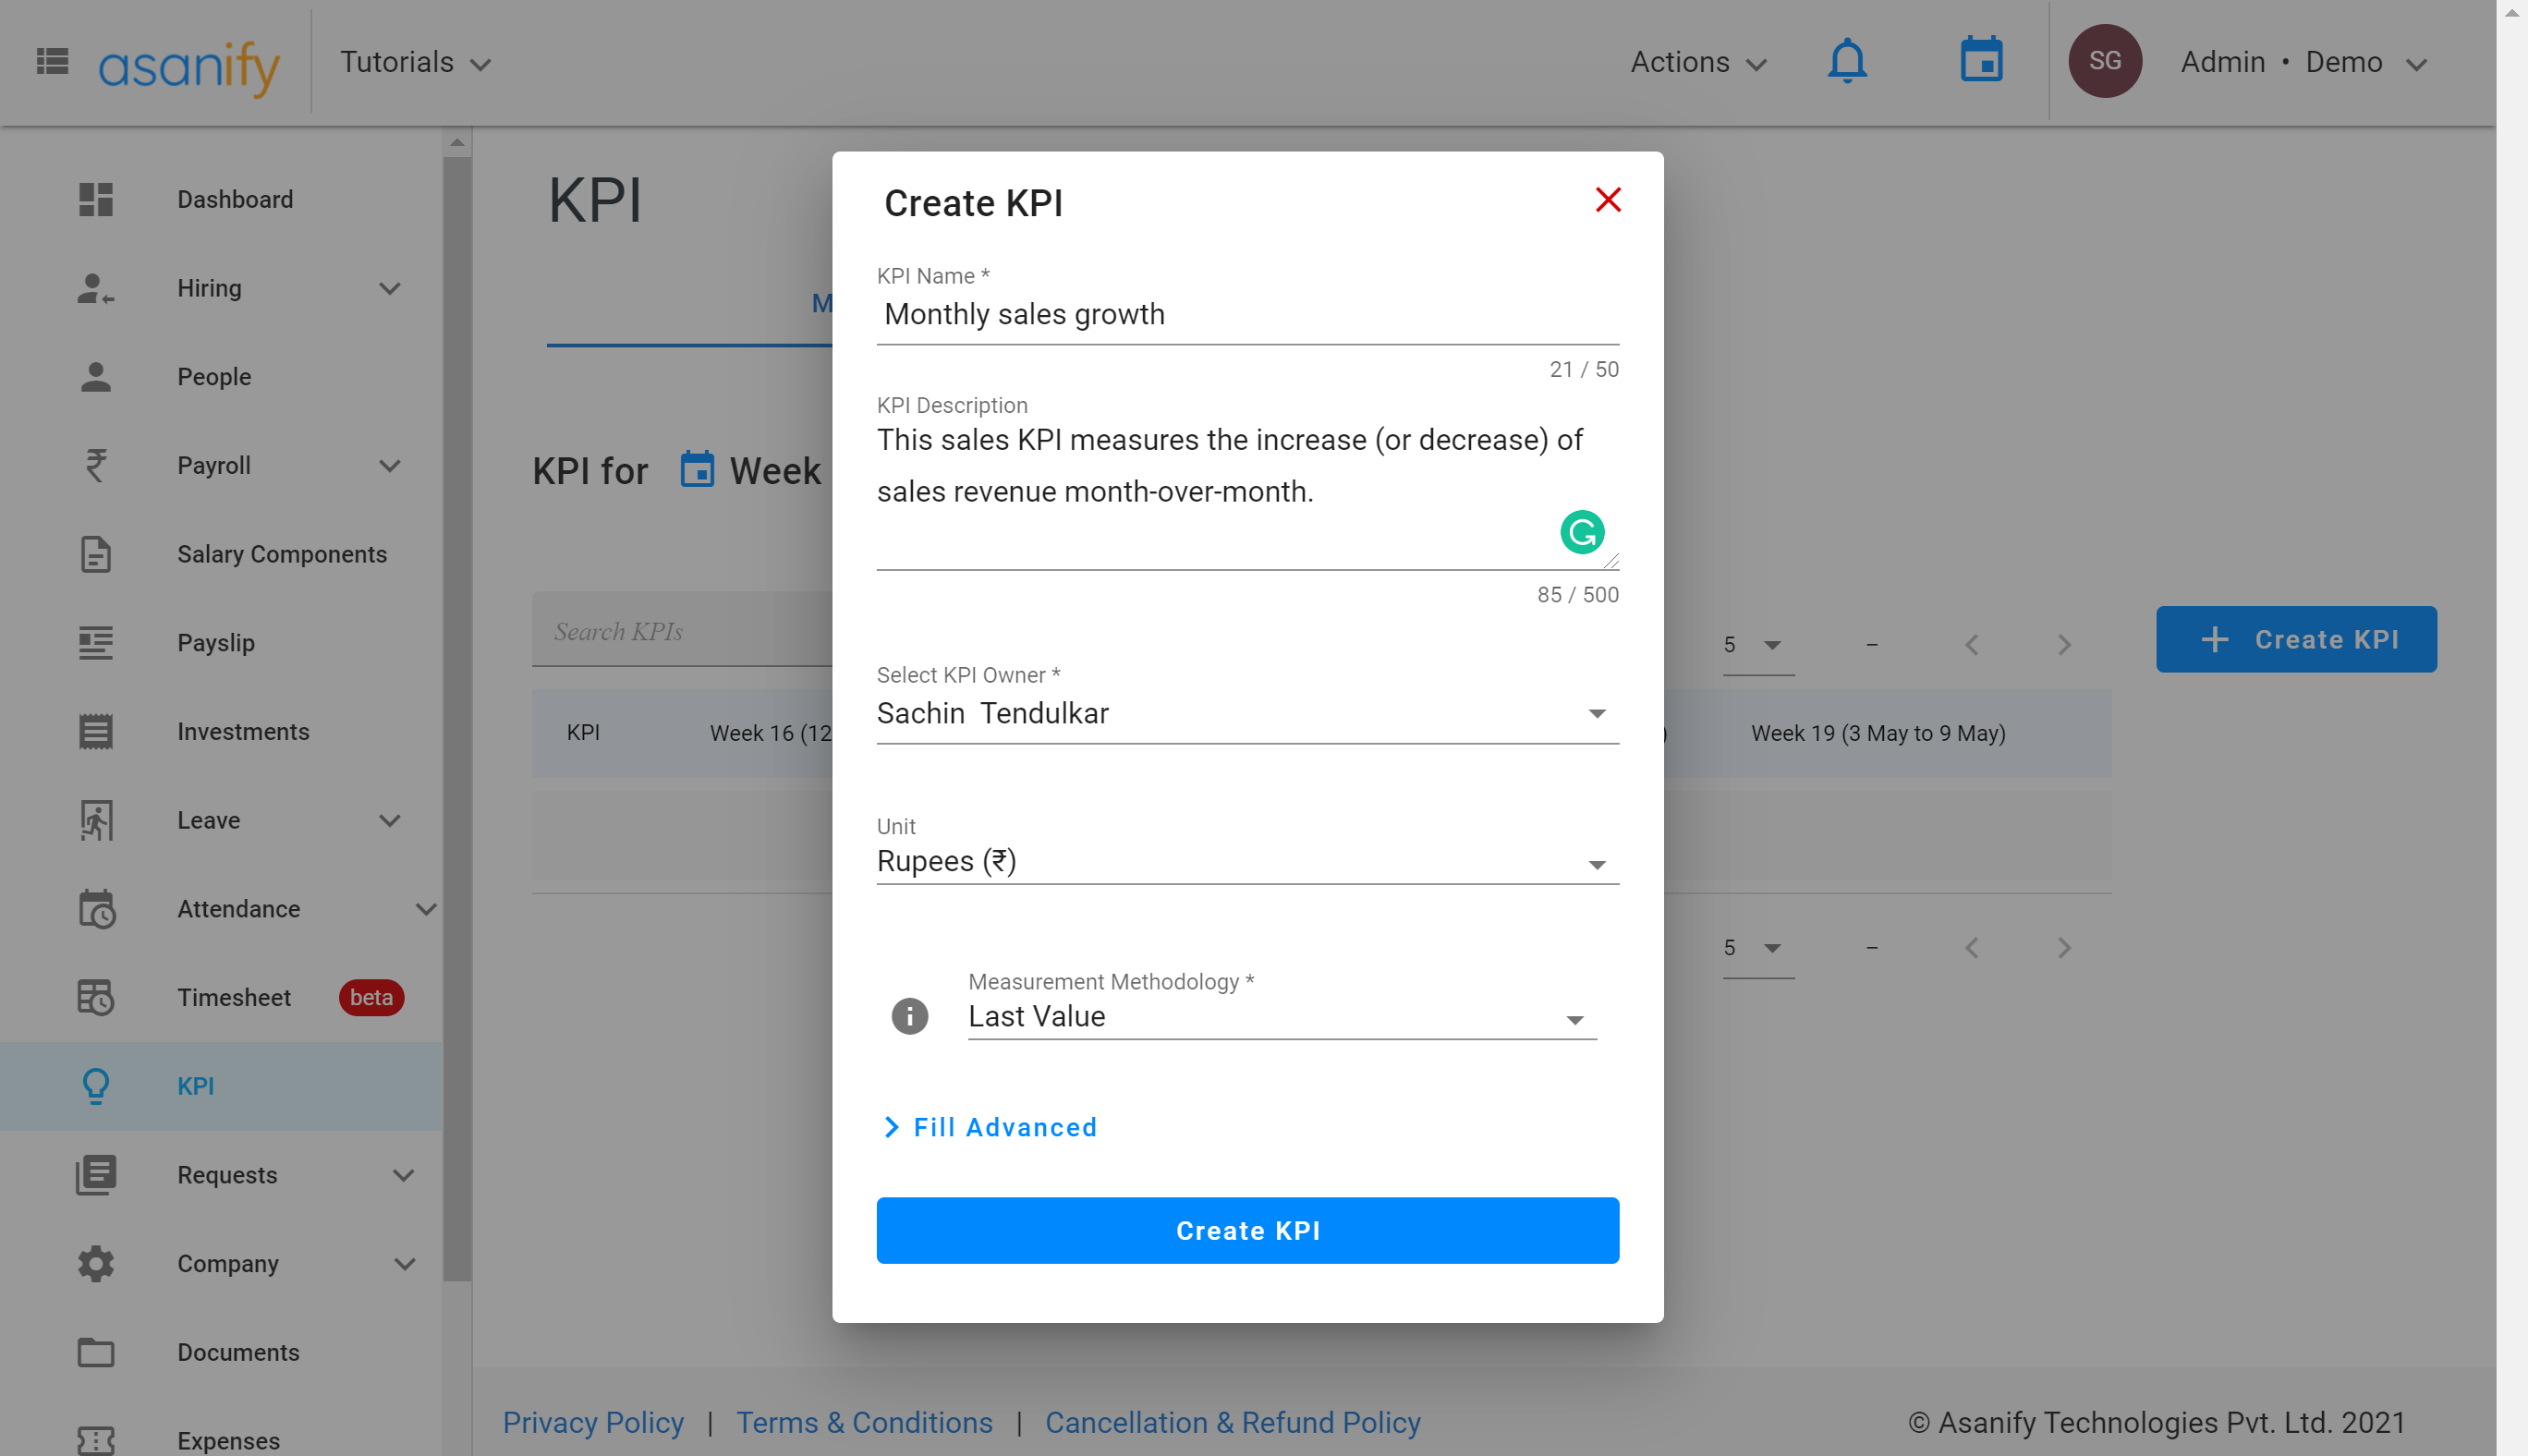
Click on the create KPI button, that appears on the right side of the screen. You will then get told to add details of the KPI.
- Add details about the KPI
Here, you will add details about the KPI you wish to create. Add owner (employee who has to follow those KPIs), description, unit of measurement, etc.

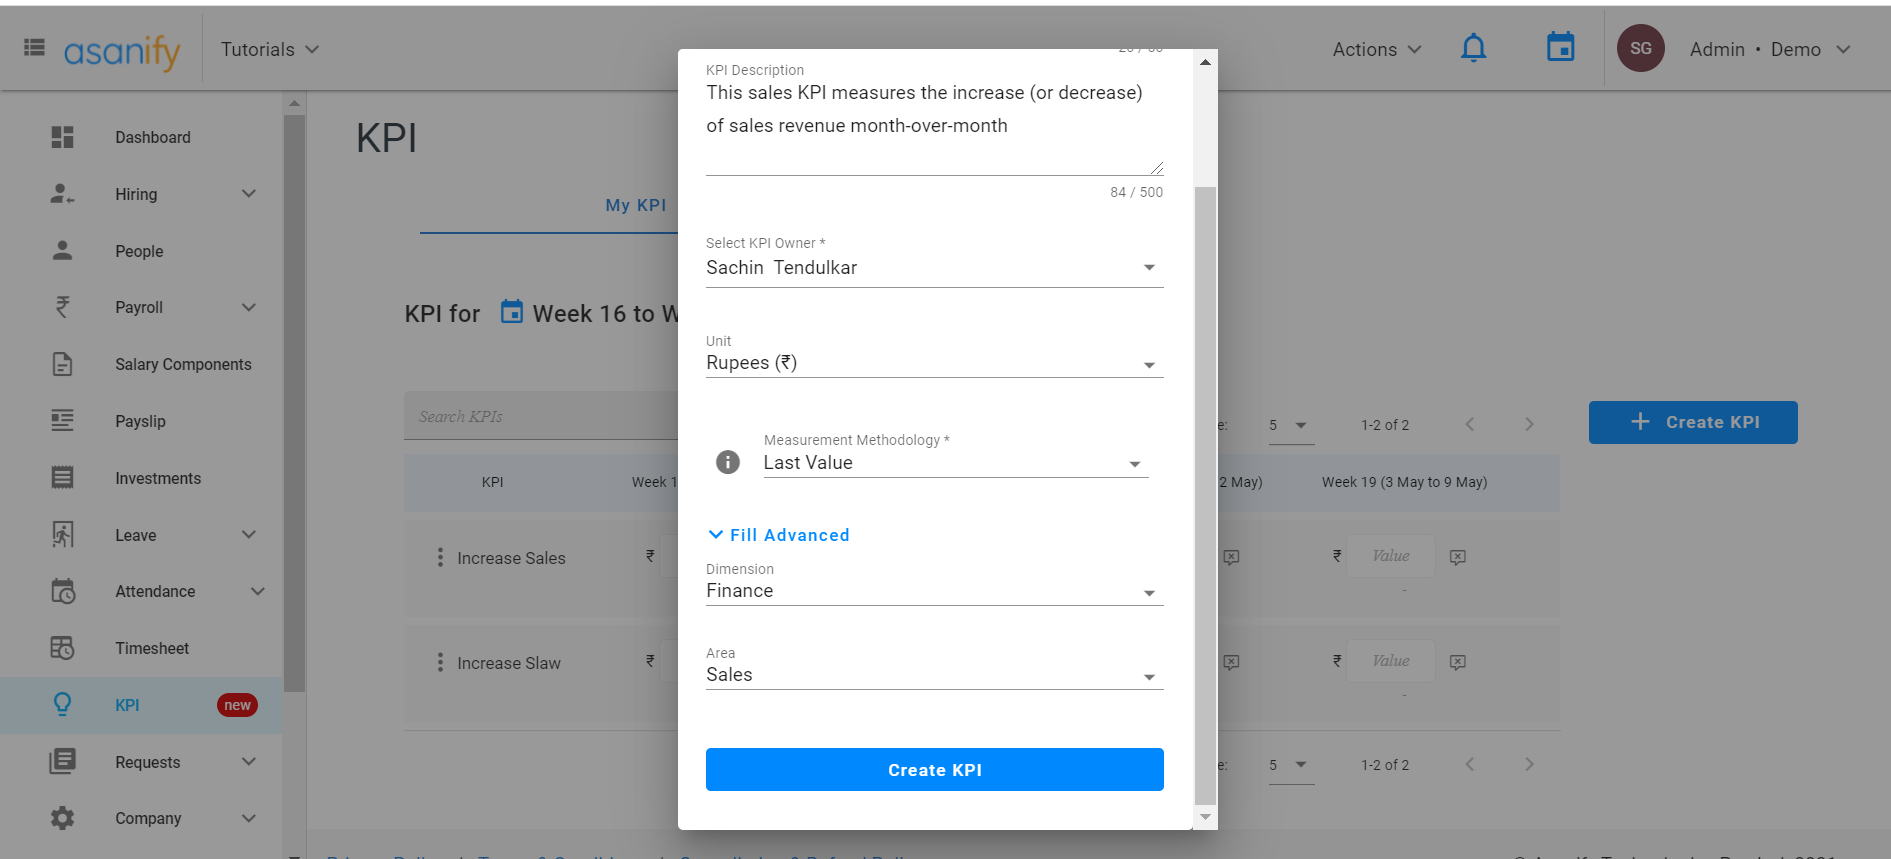
- Fill out advanced details
Add details about the KPI, its dimensions and department

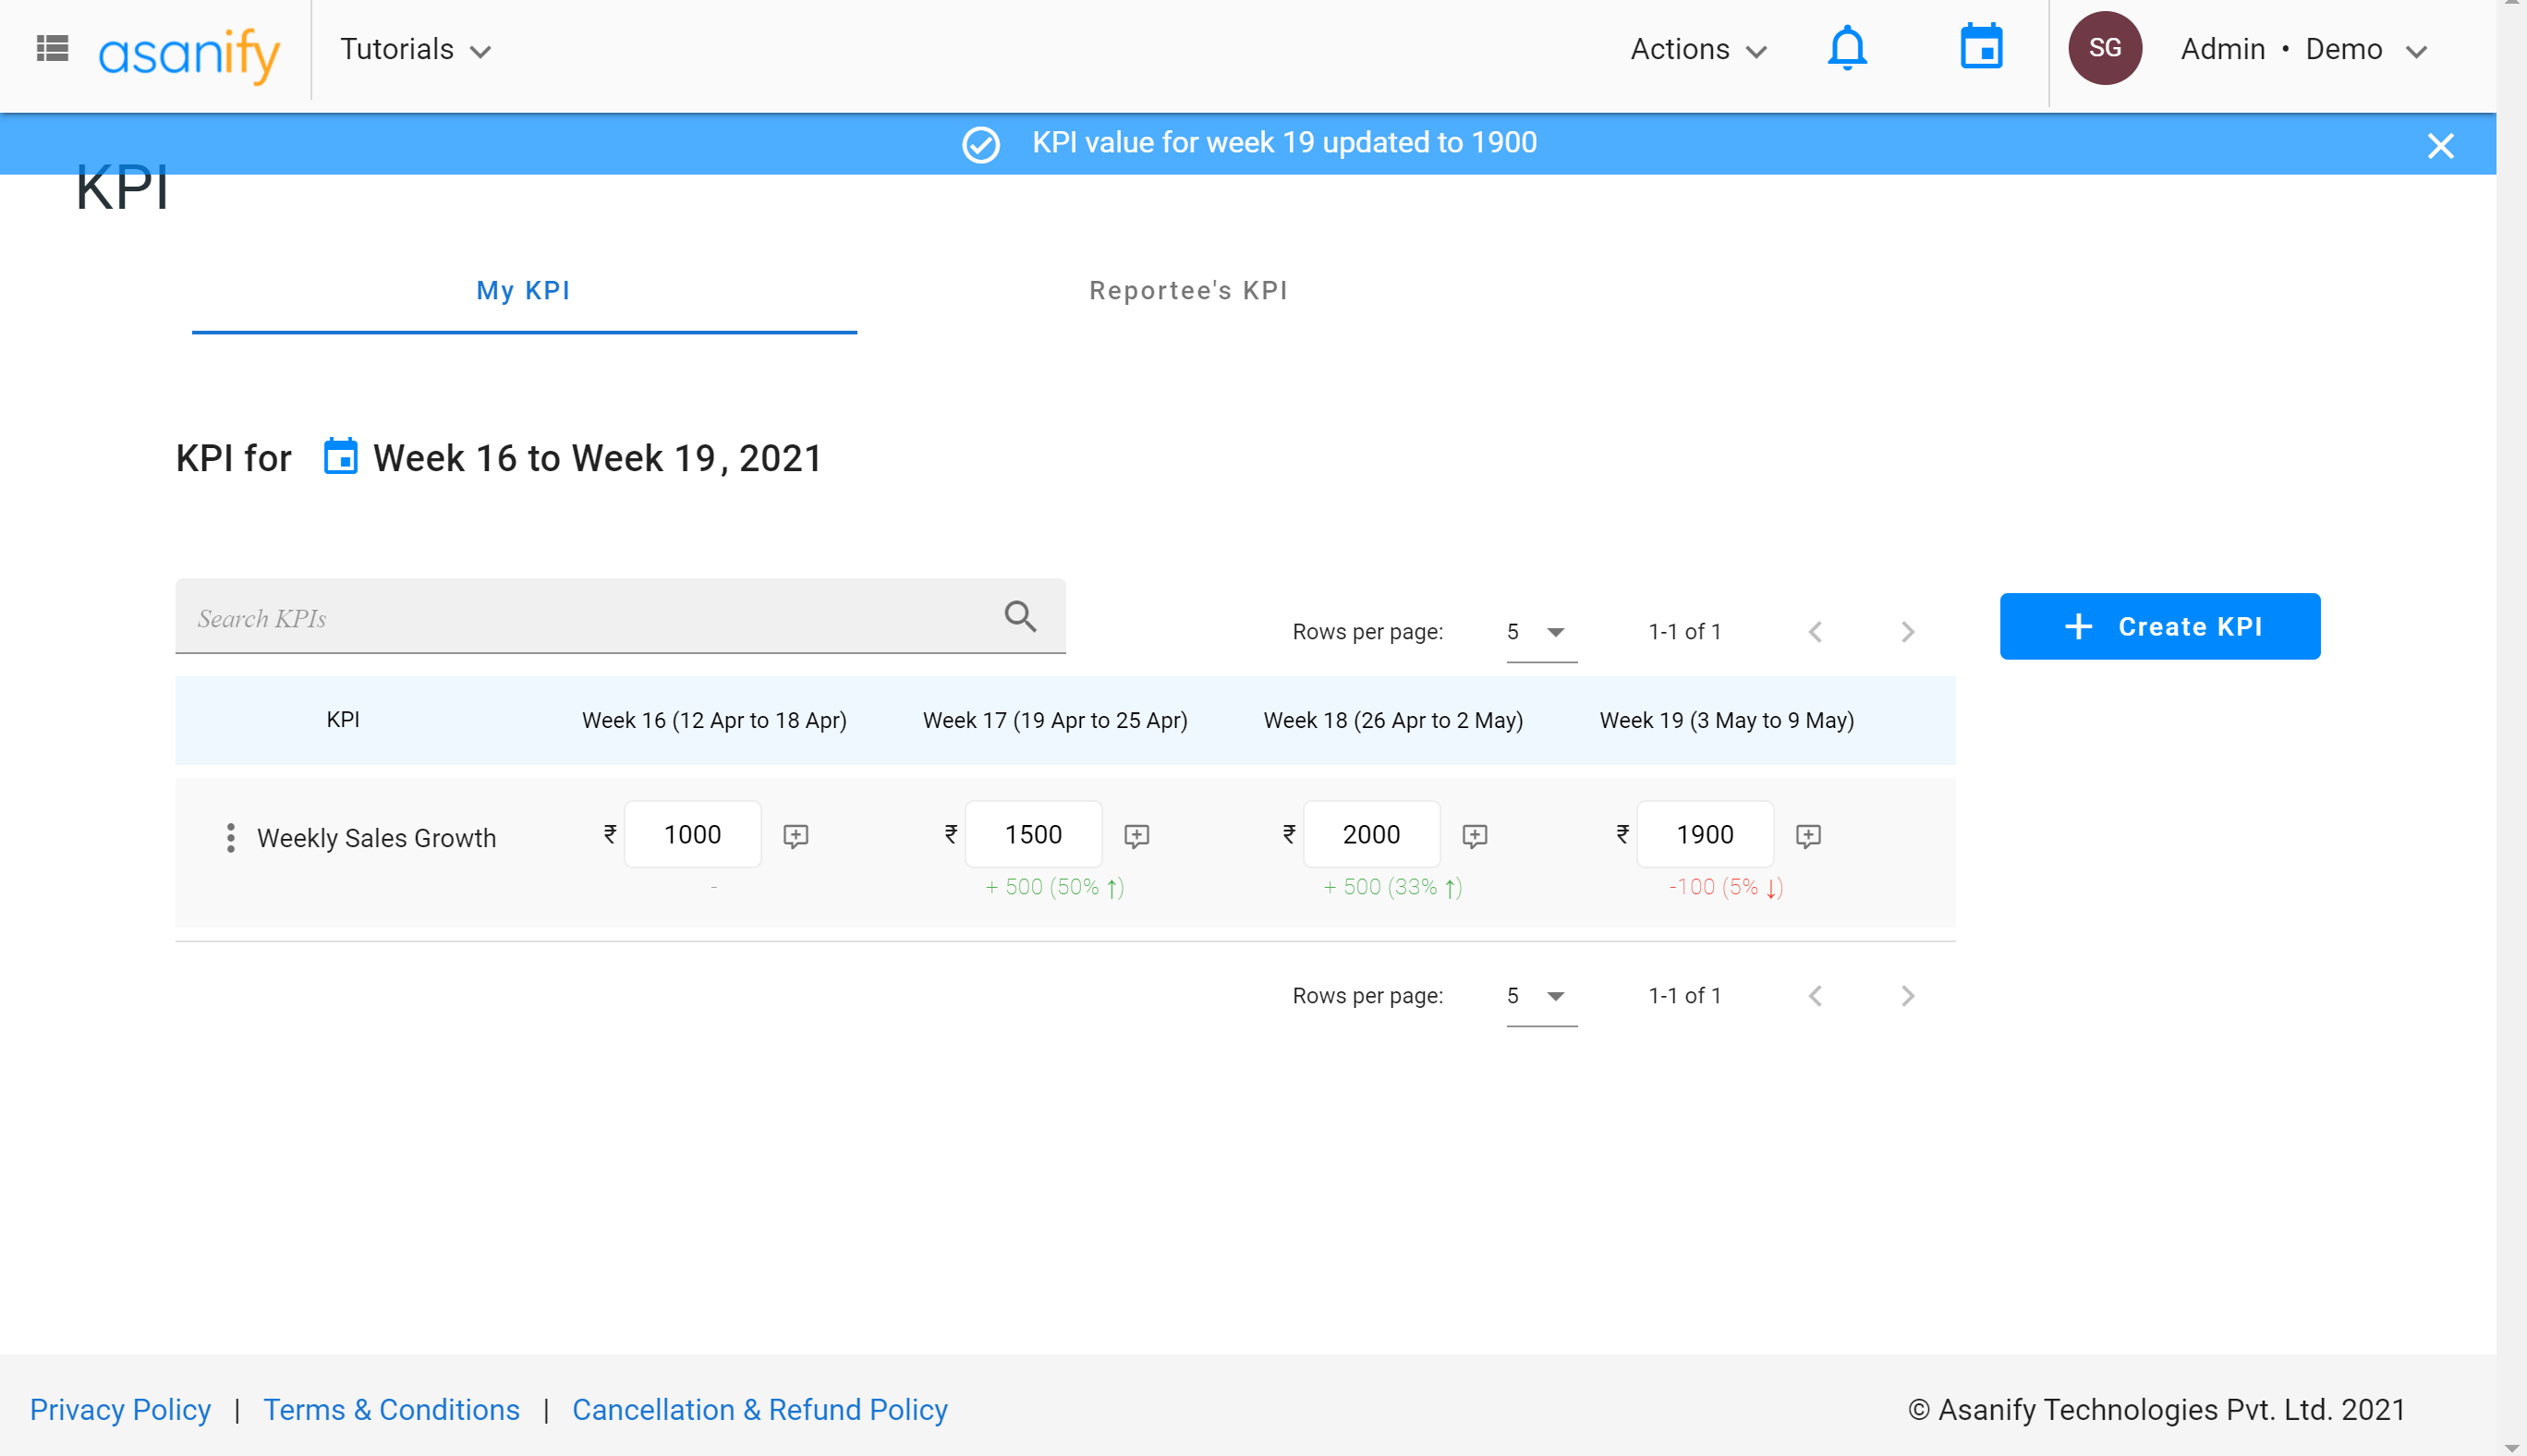
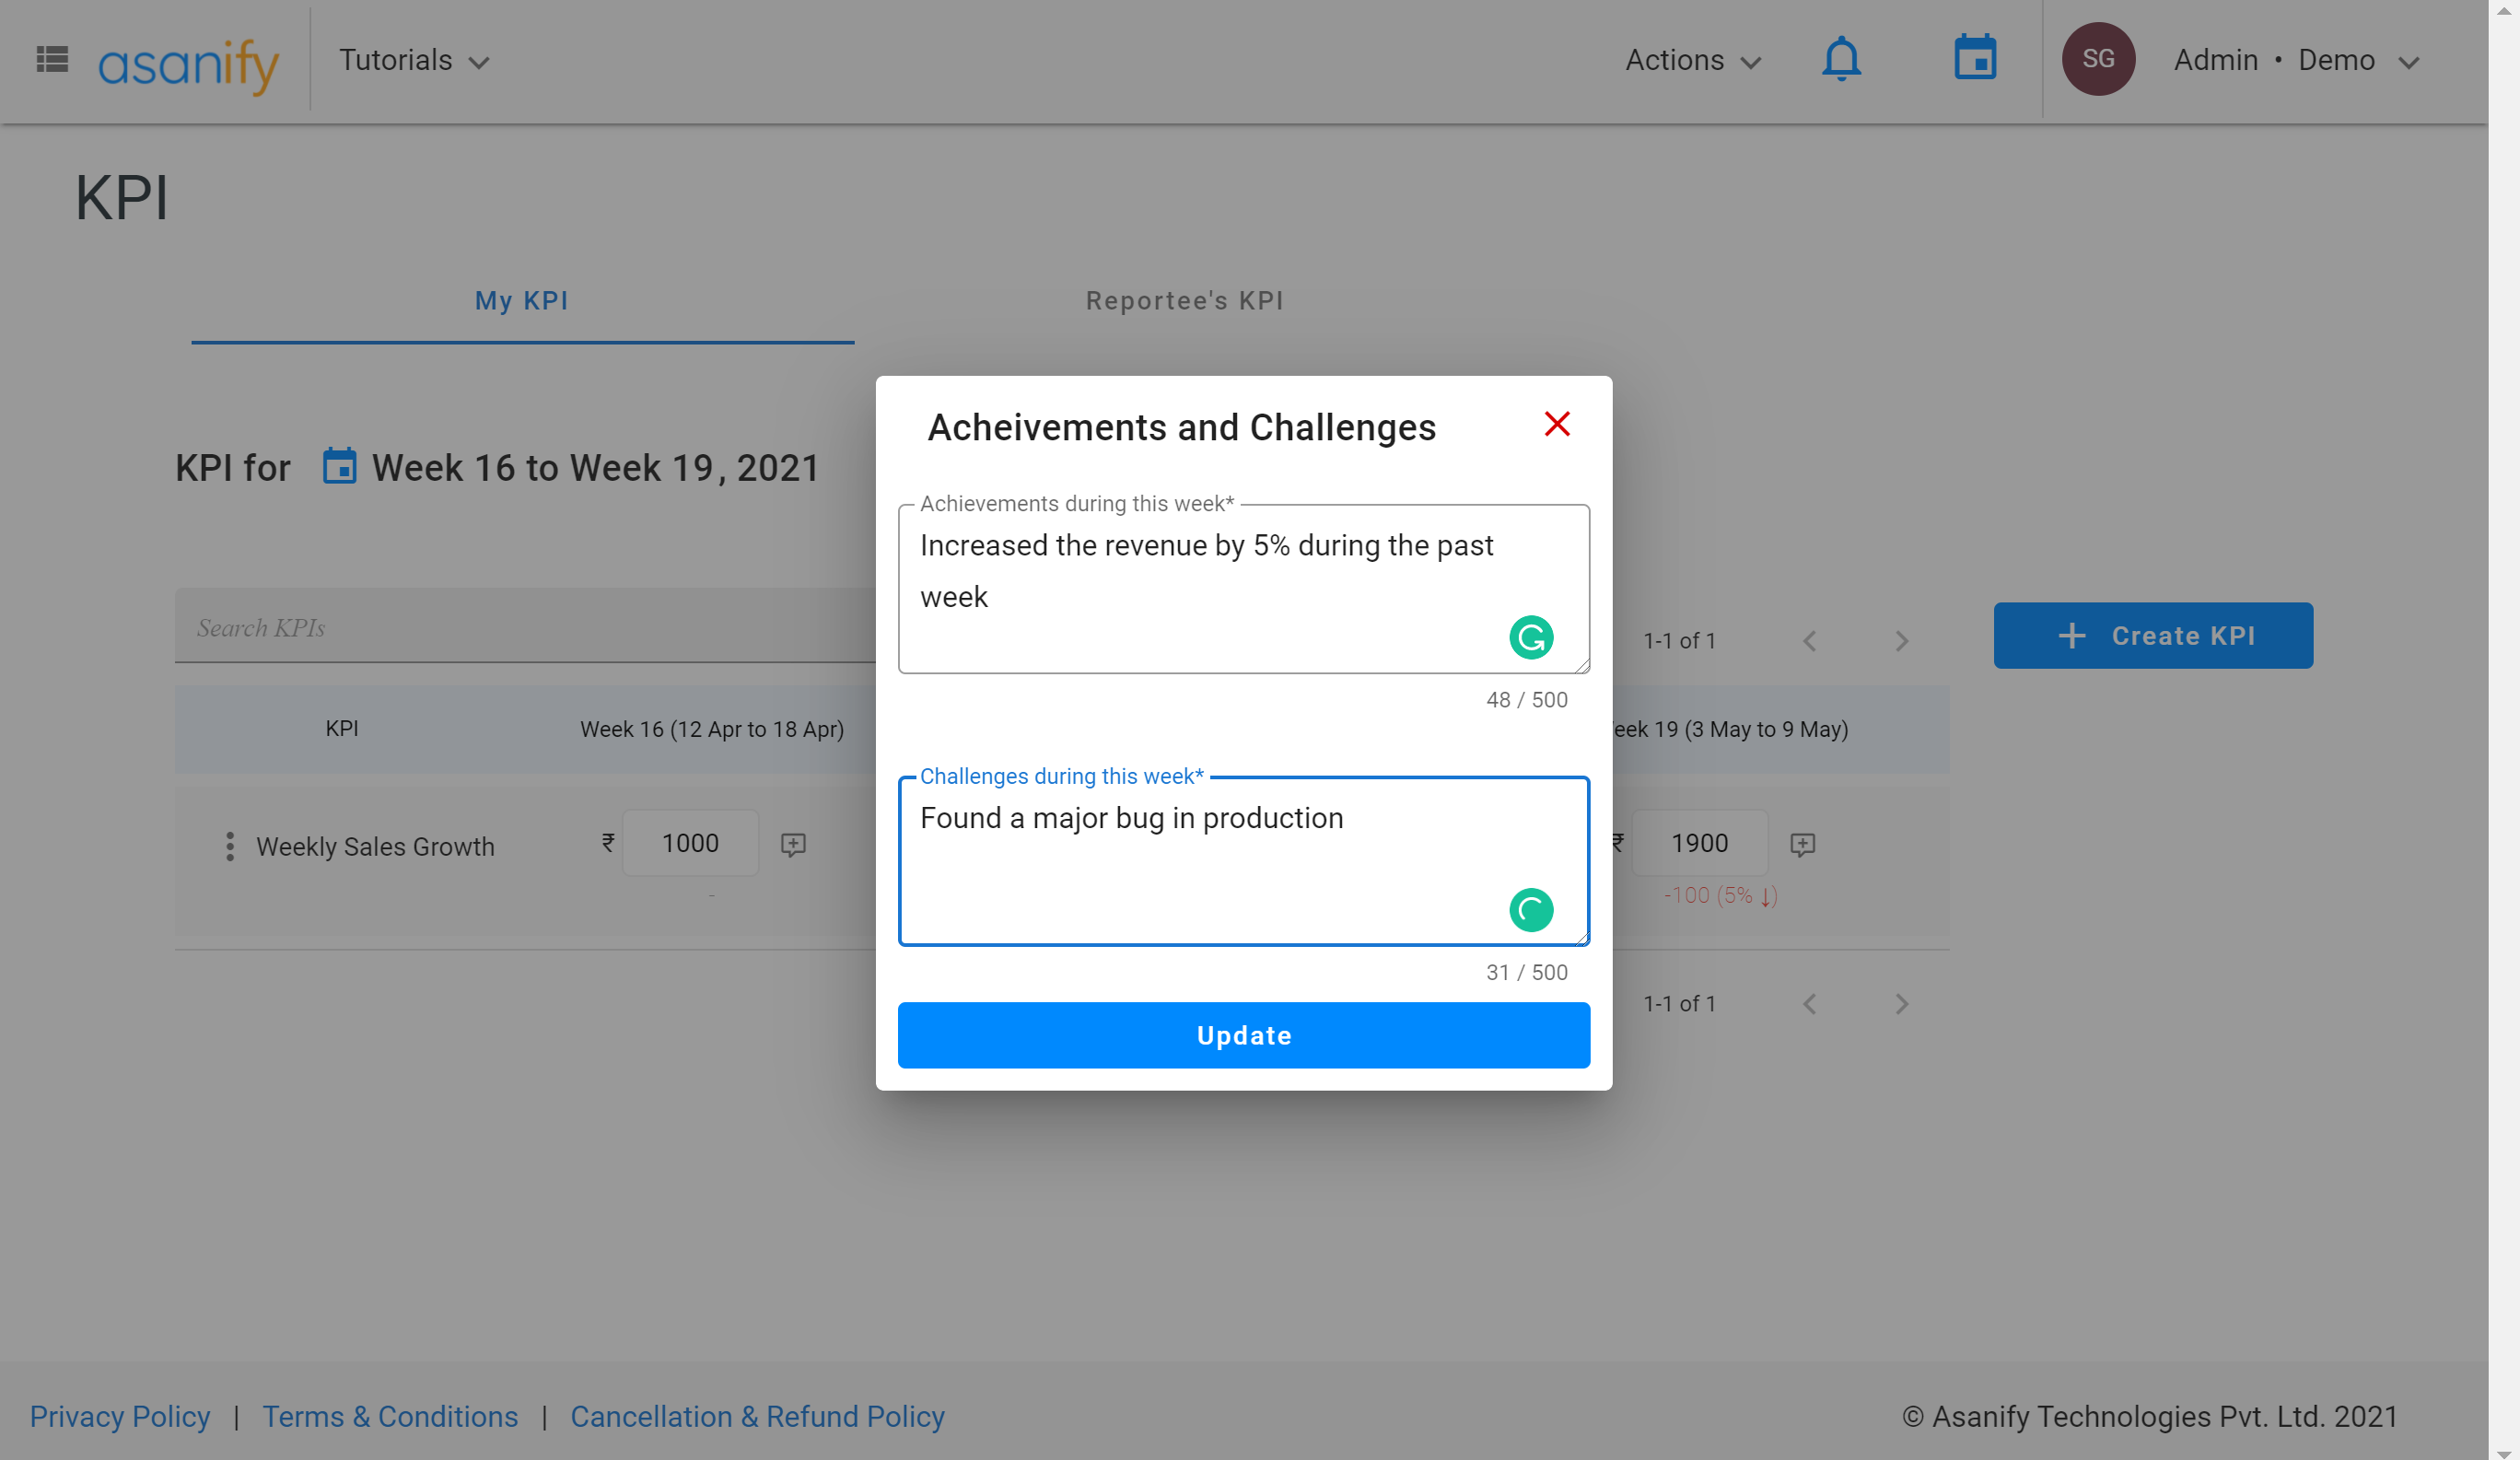
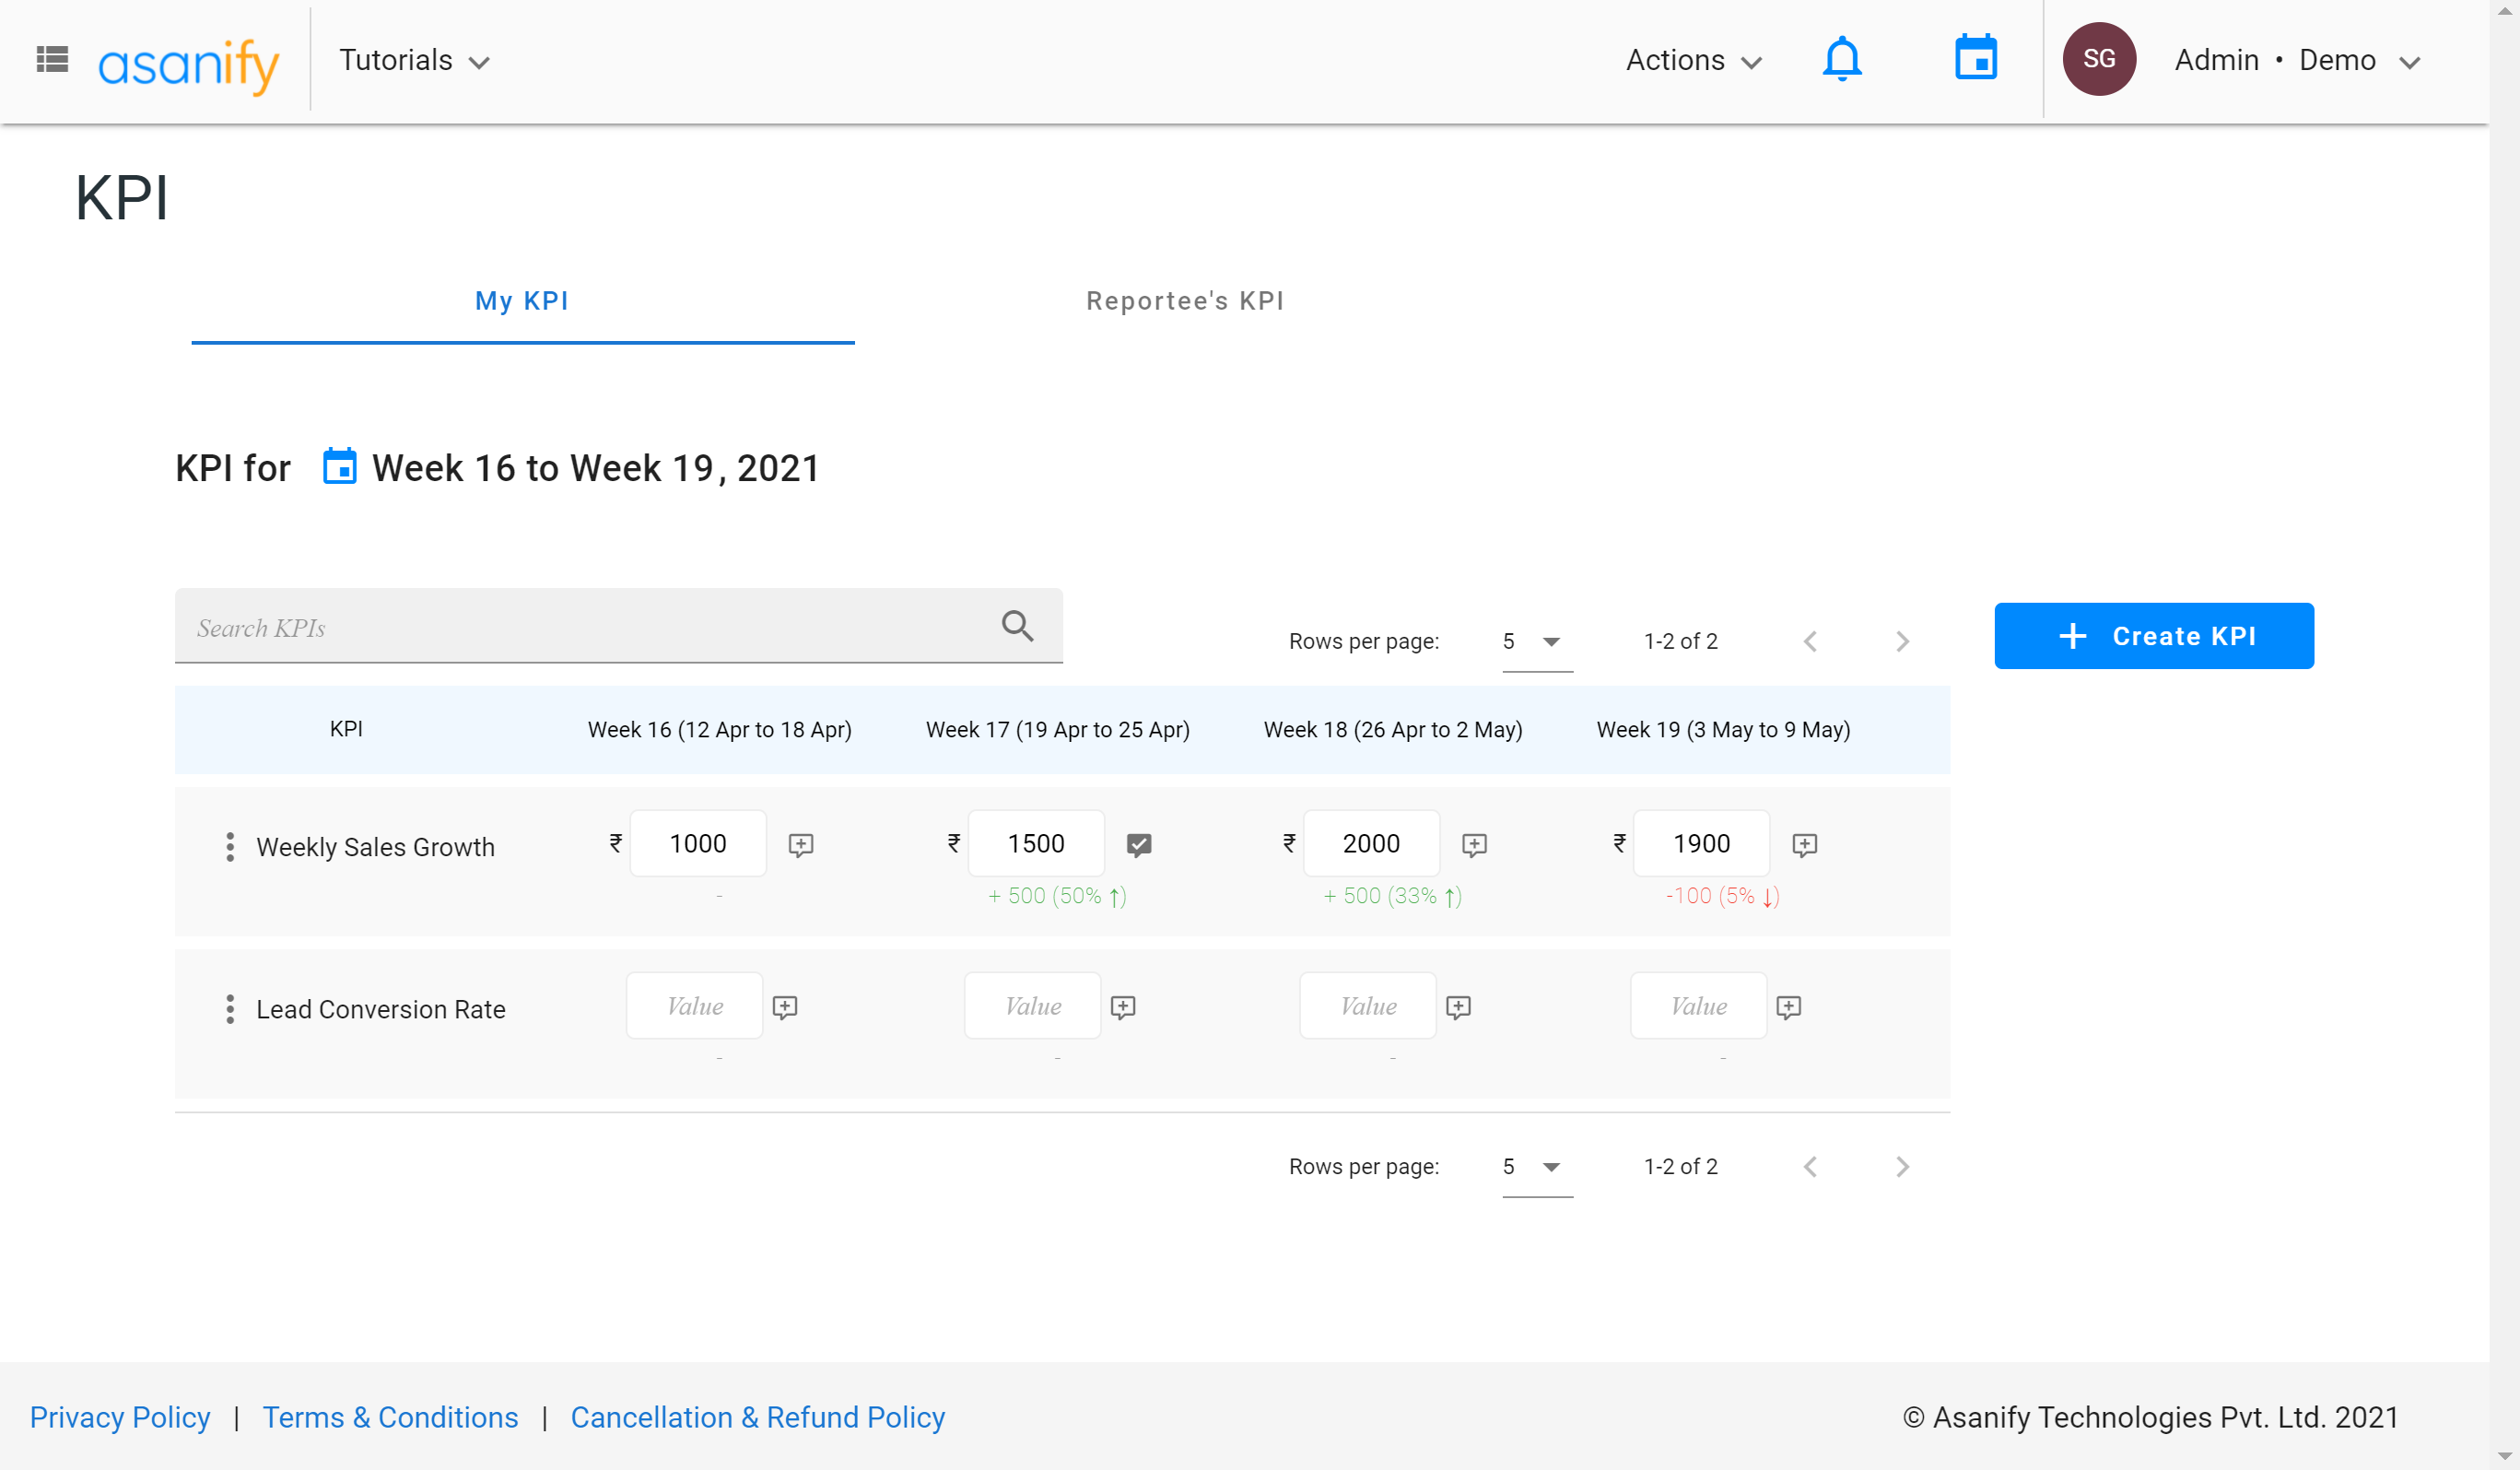
- Update the value of your KPI over time

- Add achievements and challenges for each KPI on a weekly basis

- As an employee, track all your KPIs
You will also be able to see their absolute and percentage increase/decrease in values

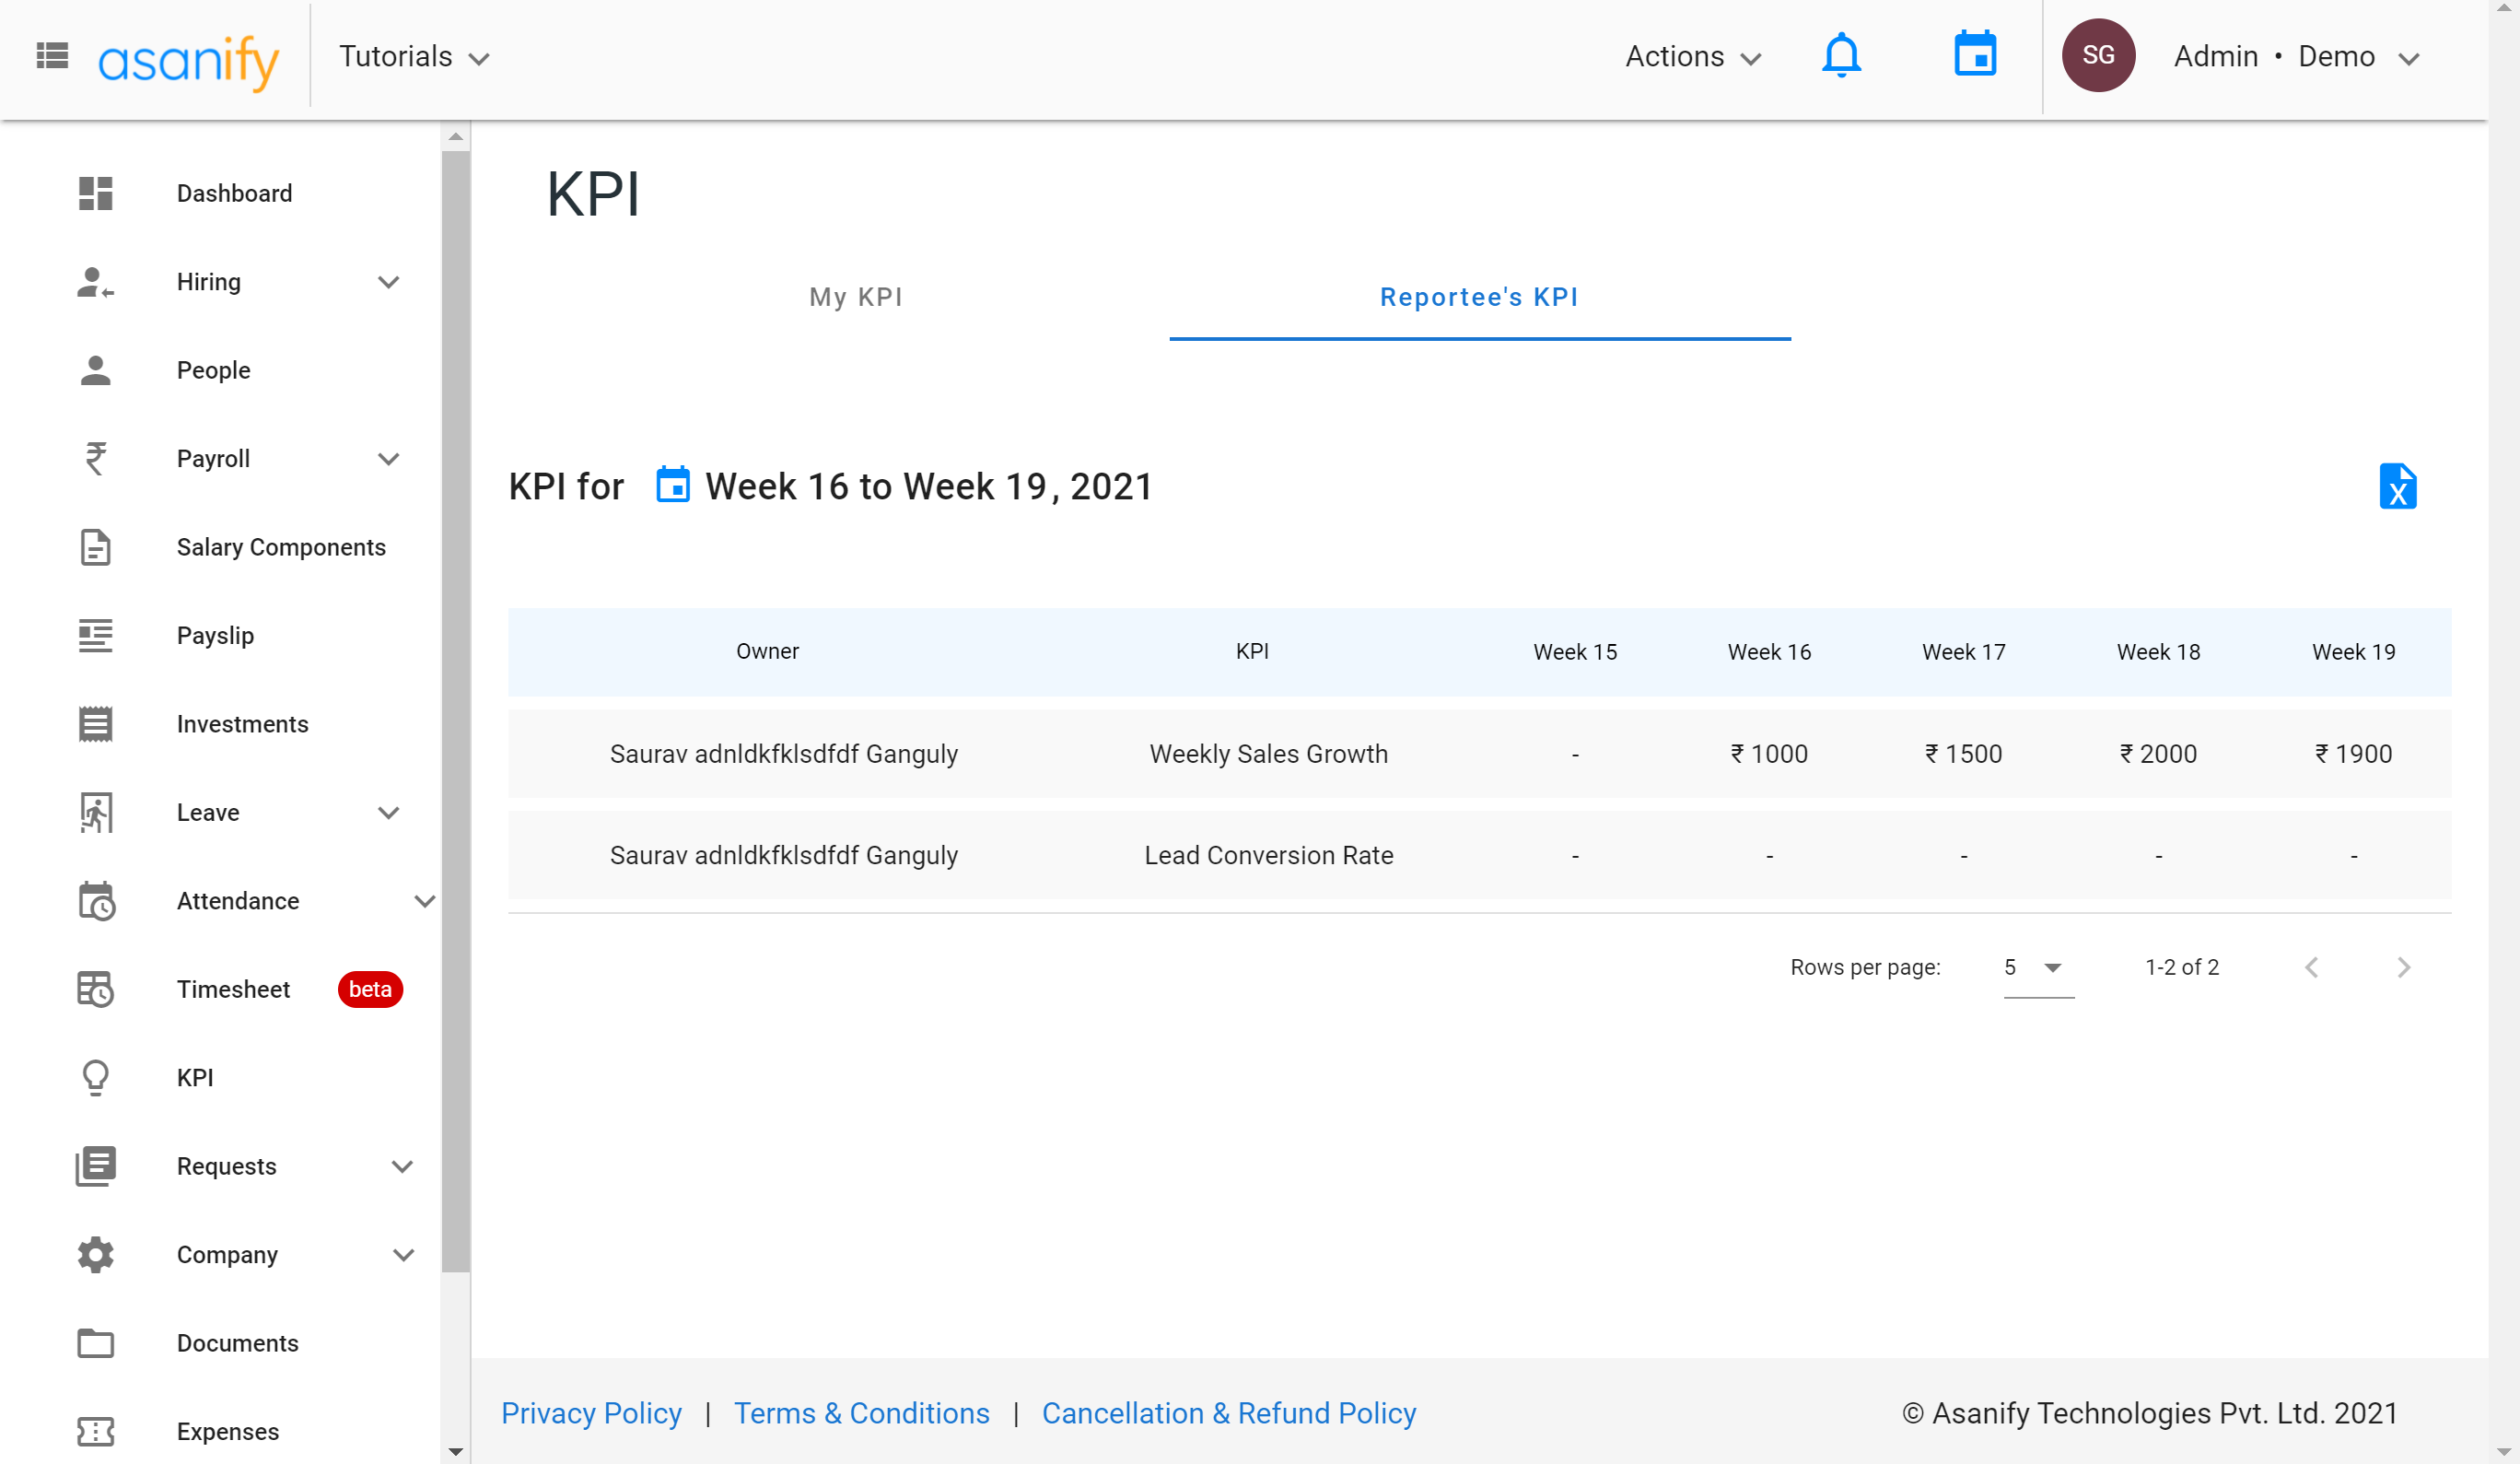
- Supervisor and admin can track KPIs and progress of multiple employees

Summary
I hope this has helped you learn more about KPIs, how to choose them well and also how to track employees’ progress during pandemics from home. Always remember that every goal and even every KPI should be S.M.A.R.T. (Specific, Measurable, Achievable, Relevant and Time-bound). Using the tips and tricks mentioned in this blog will not only help you to choose the KPIs better but also analyse them well.
Faqs
A KPI is a measurably metric you can track over a certain amount of time. A KPI helps you keep a check on your company’s growth and progress. CSAT score, net profit, sales growth, etc. are some examples of KPIs. KPIs differ based on industry and departments within organizations.
A good KPI is a SMART one. Meaning one that is Specific, Measurable, Achievable, Relevant and Time-bound. An excellent set of KPIs also includes good amounts of leading and lagging KPIs.
A KPI in HR, i.e.,, human resources, would be a KPI that tracks employed and people-related factors. Some examples are.
1. Employee retention score
2. Gender diversity ratio
3. Training sessions conducted throughout the year, etc.
Not to be considered as tax, legal, financial or HR advice. Regulations change over time so please consult a lawyer, accountant or Labour Law expert for specific guidance.


